Audits
An audit scans a site the way Explore does, then checks every page it reaches two ways: for accessibility issues, and for buttons, form fields, and checkboxes whose style breaks the site’s own pattern.
What an audit checks
- Accessibility
- axe-core’s checks against WCAG 2.0 to 2.2, levels A and AA, plus its best practices: missing labels and alt text, low contrast, and more. On by default; switch off Check accessibility to skip it.
- Buttons
- Every button’s font, colors, corners, padding, and size, compared across the site.
- Form fields
- Text inputs, selects, and text areas: font, height, borders, fill, and placeholder color.
- Checkboxes and radios
- Checkboxes, radio buttons, and switches, each compared only with its own kind.
- Page loads
- Whether each page loaded cleanly (no error page, none of the site’s files missing, no script errors), and how long it took to show its main content.
“Breaks the pattern” means two things. A rare trait is a style few elements use while most share another, like the one pill-shaped button on a site of square ones. A near miss is a value just off a common one, like a green two shades away from the brand green. Differences too small to see, like 1px, are listed separately as minor.
Start an audit
On Audits, choose New audit, paste the start page, and pick how many pages to scan.
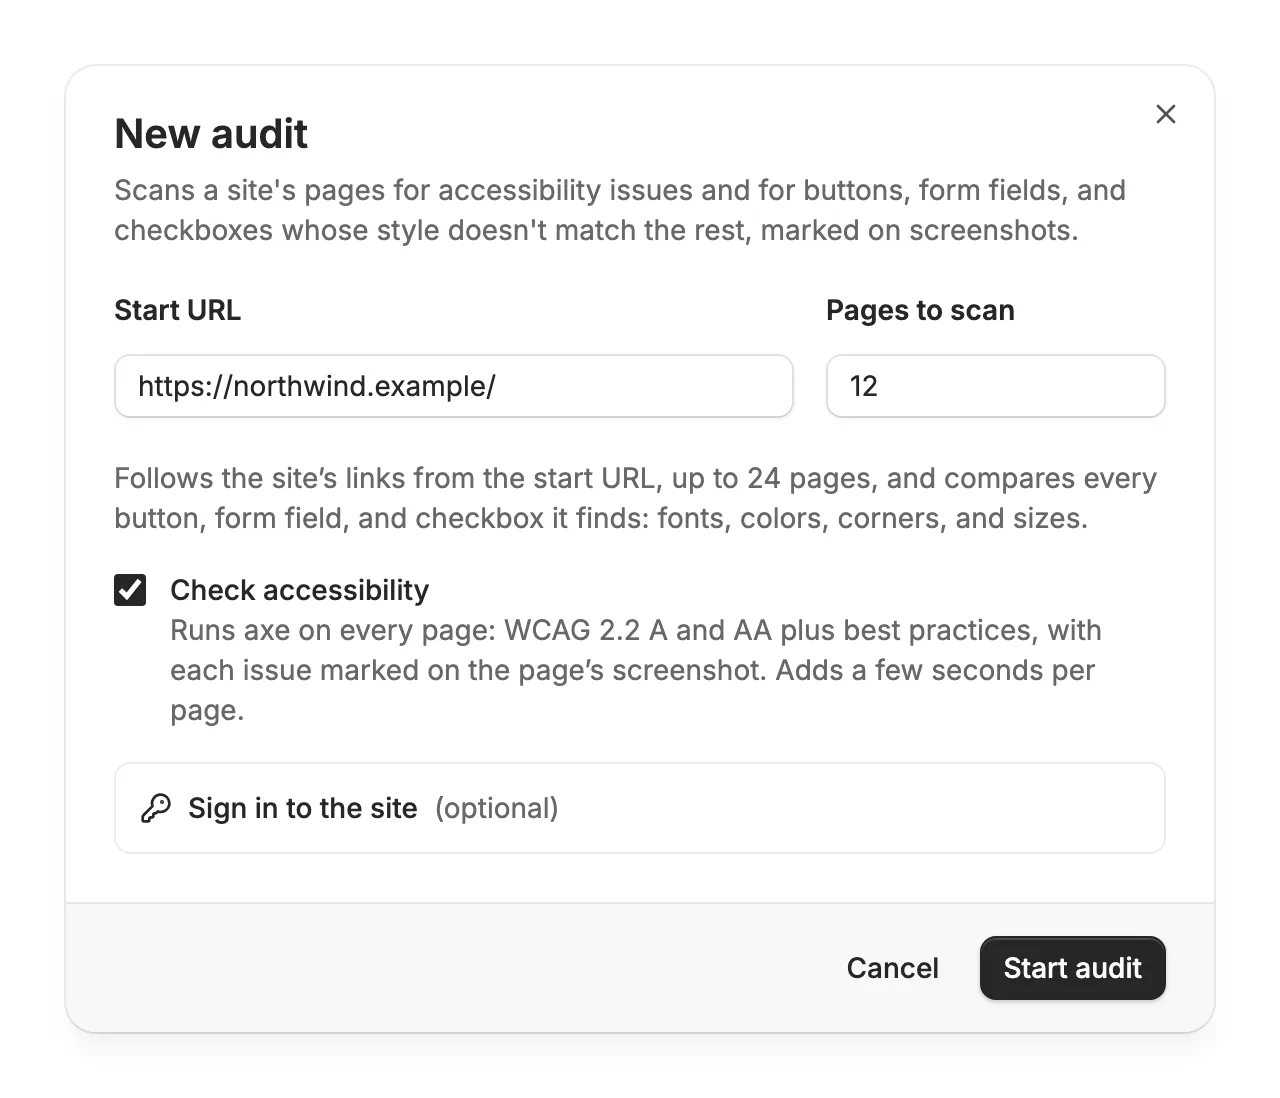
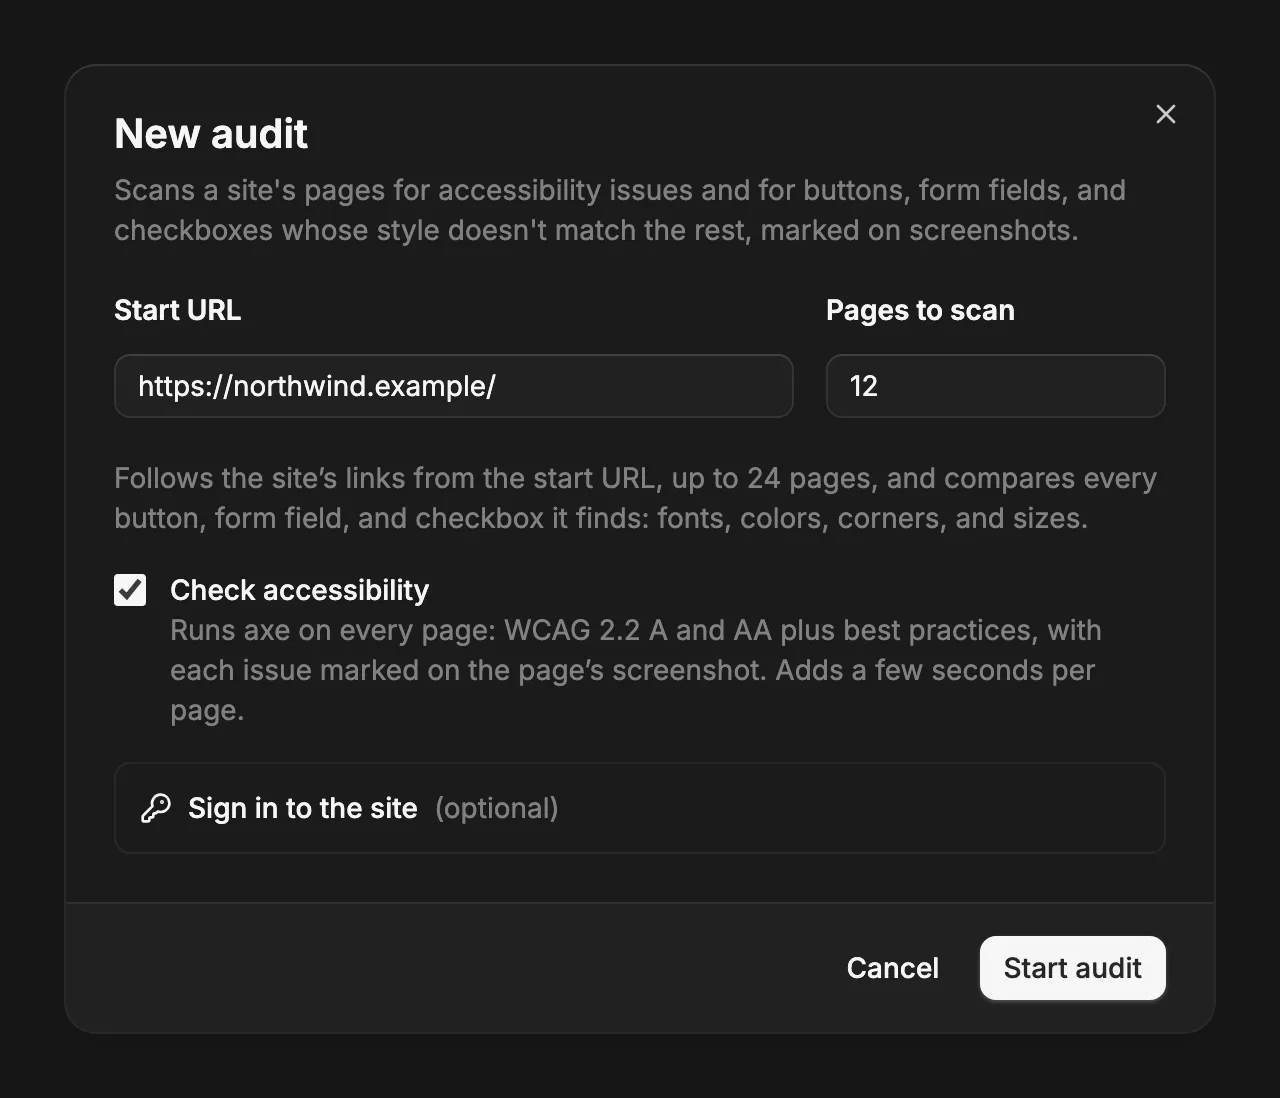
It scans 12 pages unless you change it, up to 24, following links the way Explore does. Audits always browse as a desktop.
Start with the overview
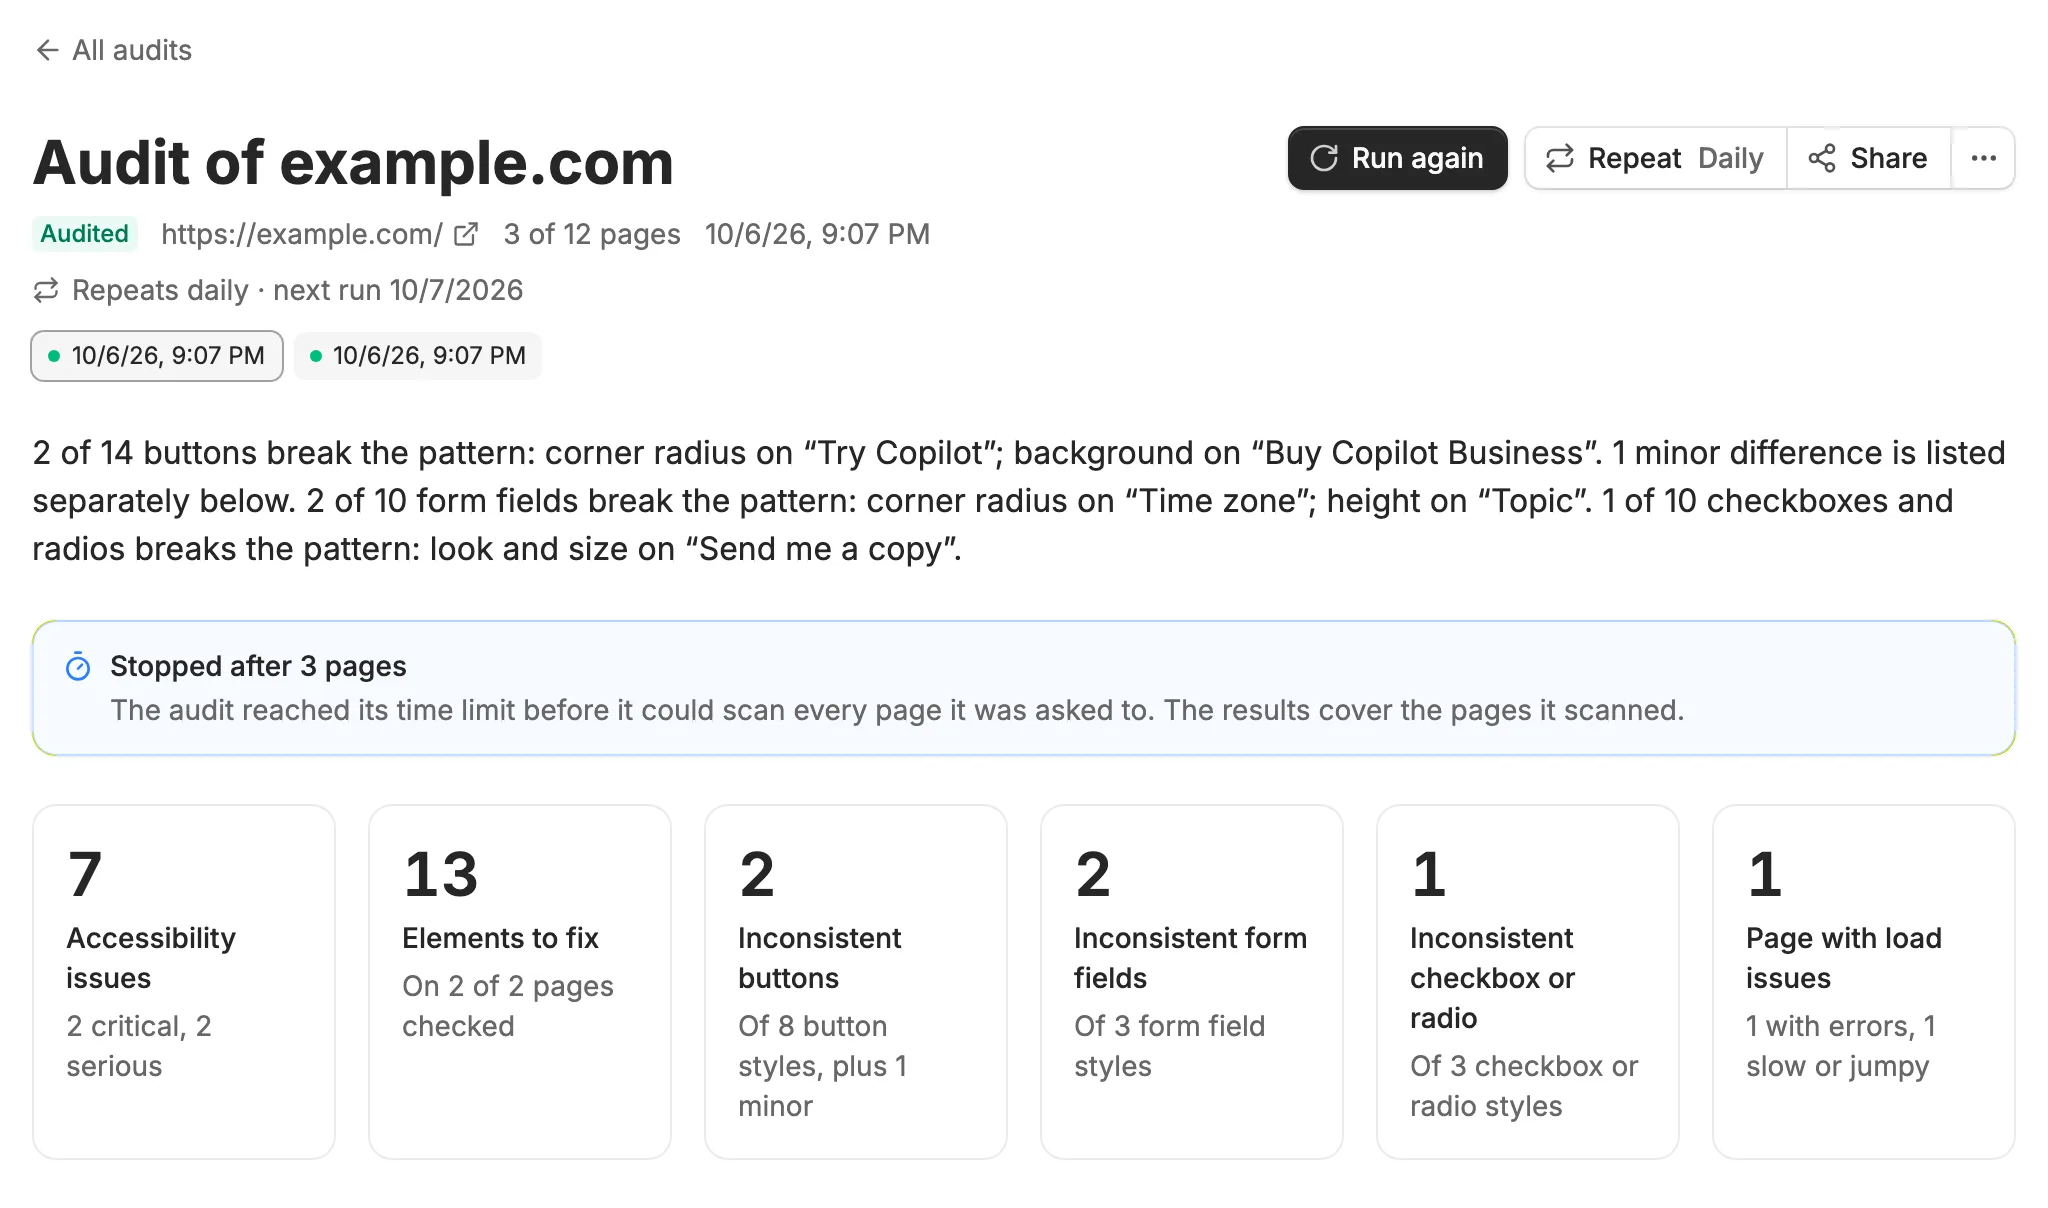
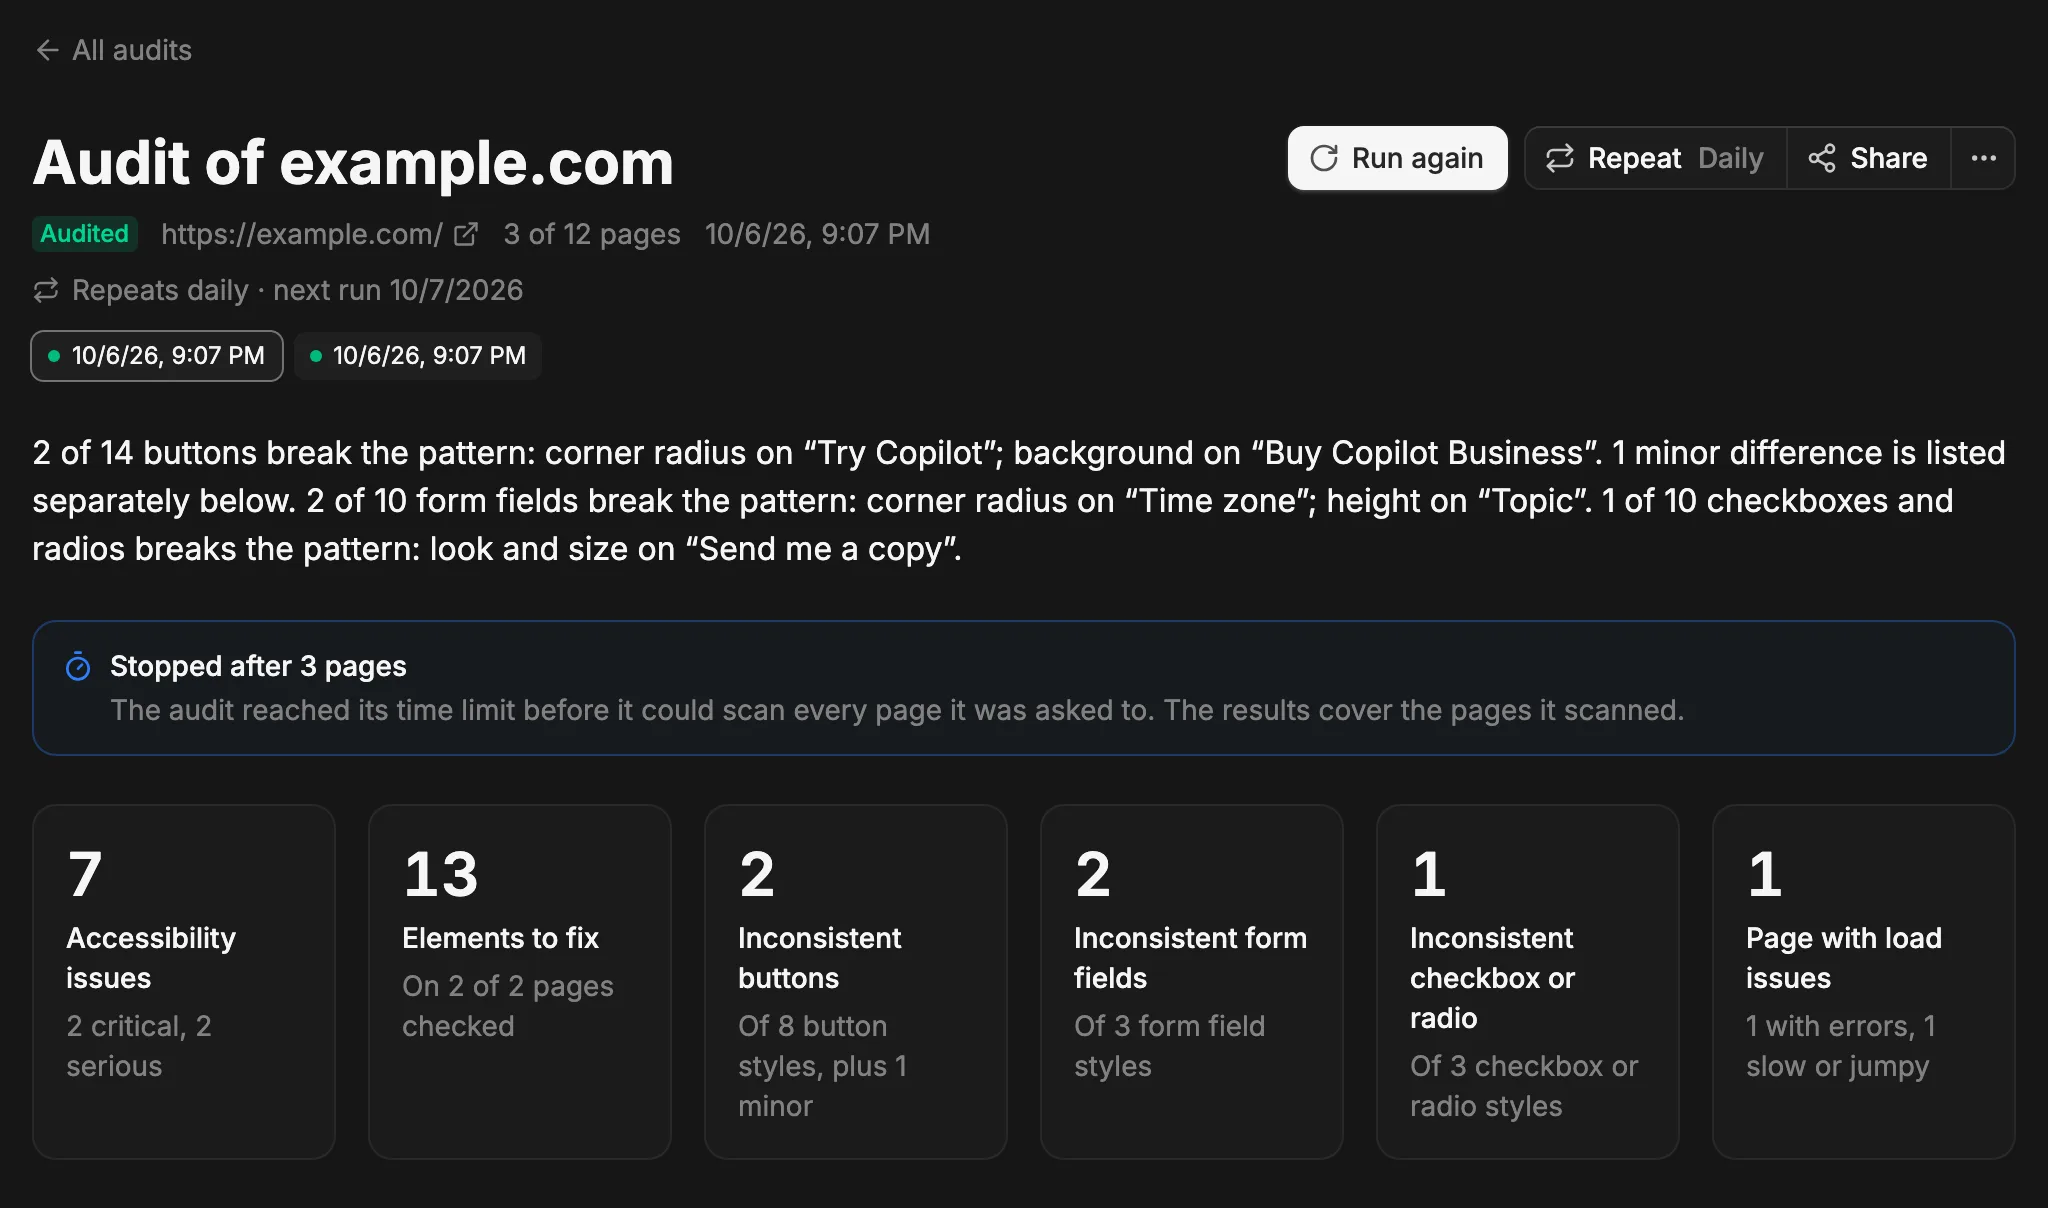
The report opens with one sentence on what it found, then a tile for each headline number. Each tile jumps to its section.
Accessibility issues
Each failed rule is one row, numbered, and grouped by how badly it affects people:
- Blocks some people from using the page.
- Makes the page very hard to use for some people.
- Makes the page harder to use for some people.
- A nuisance for some people.
Open a row to see the page with that rule’s elements outlined, what to fix, and the failing markup on every page it fails on.
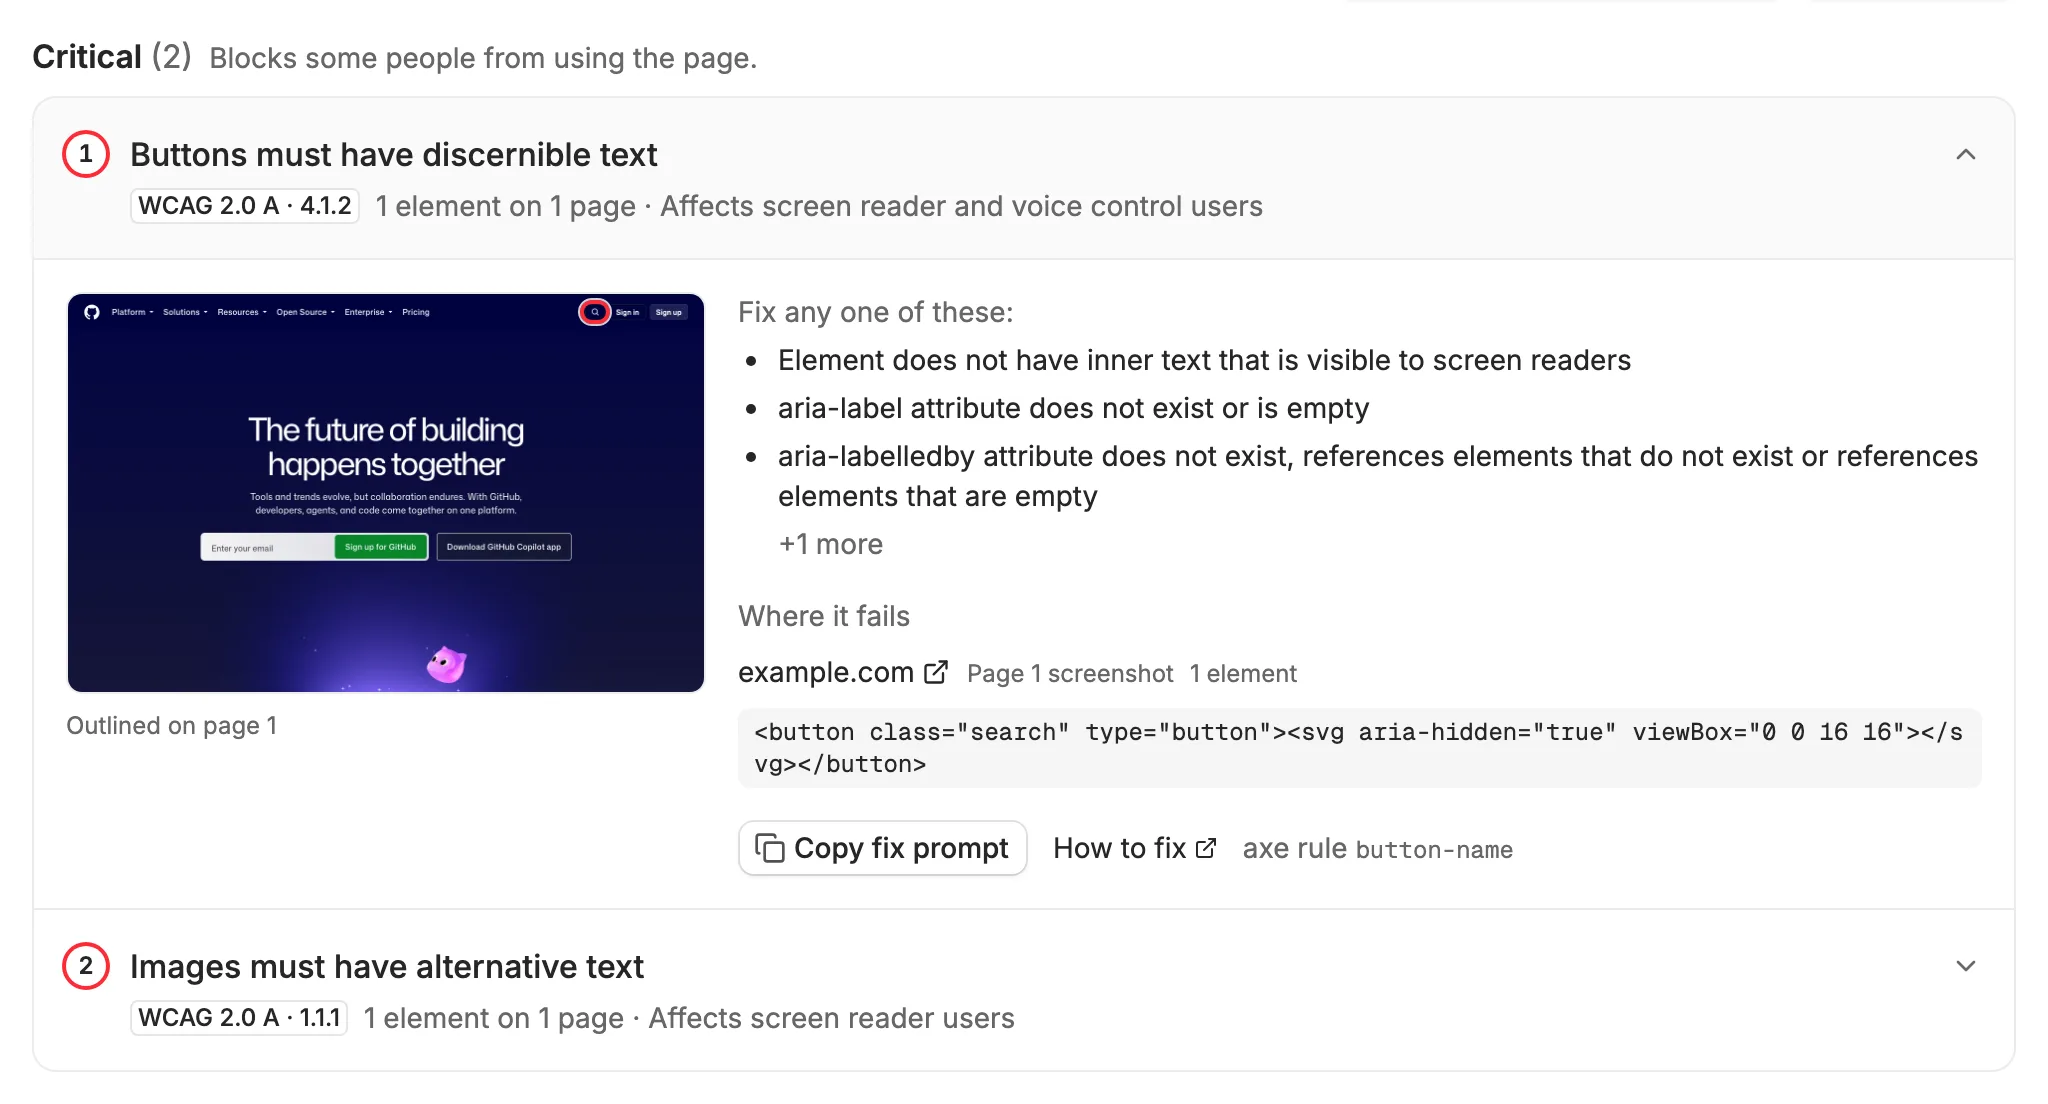
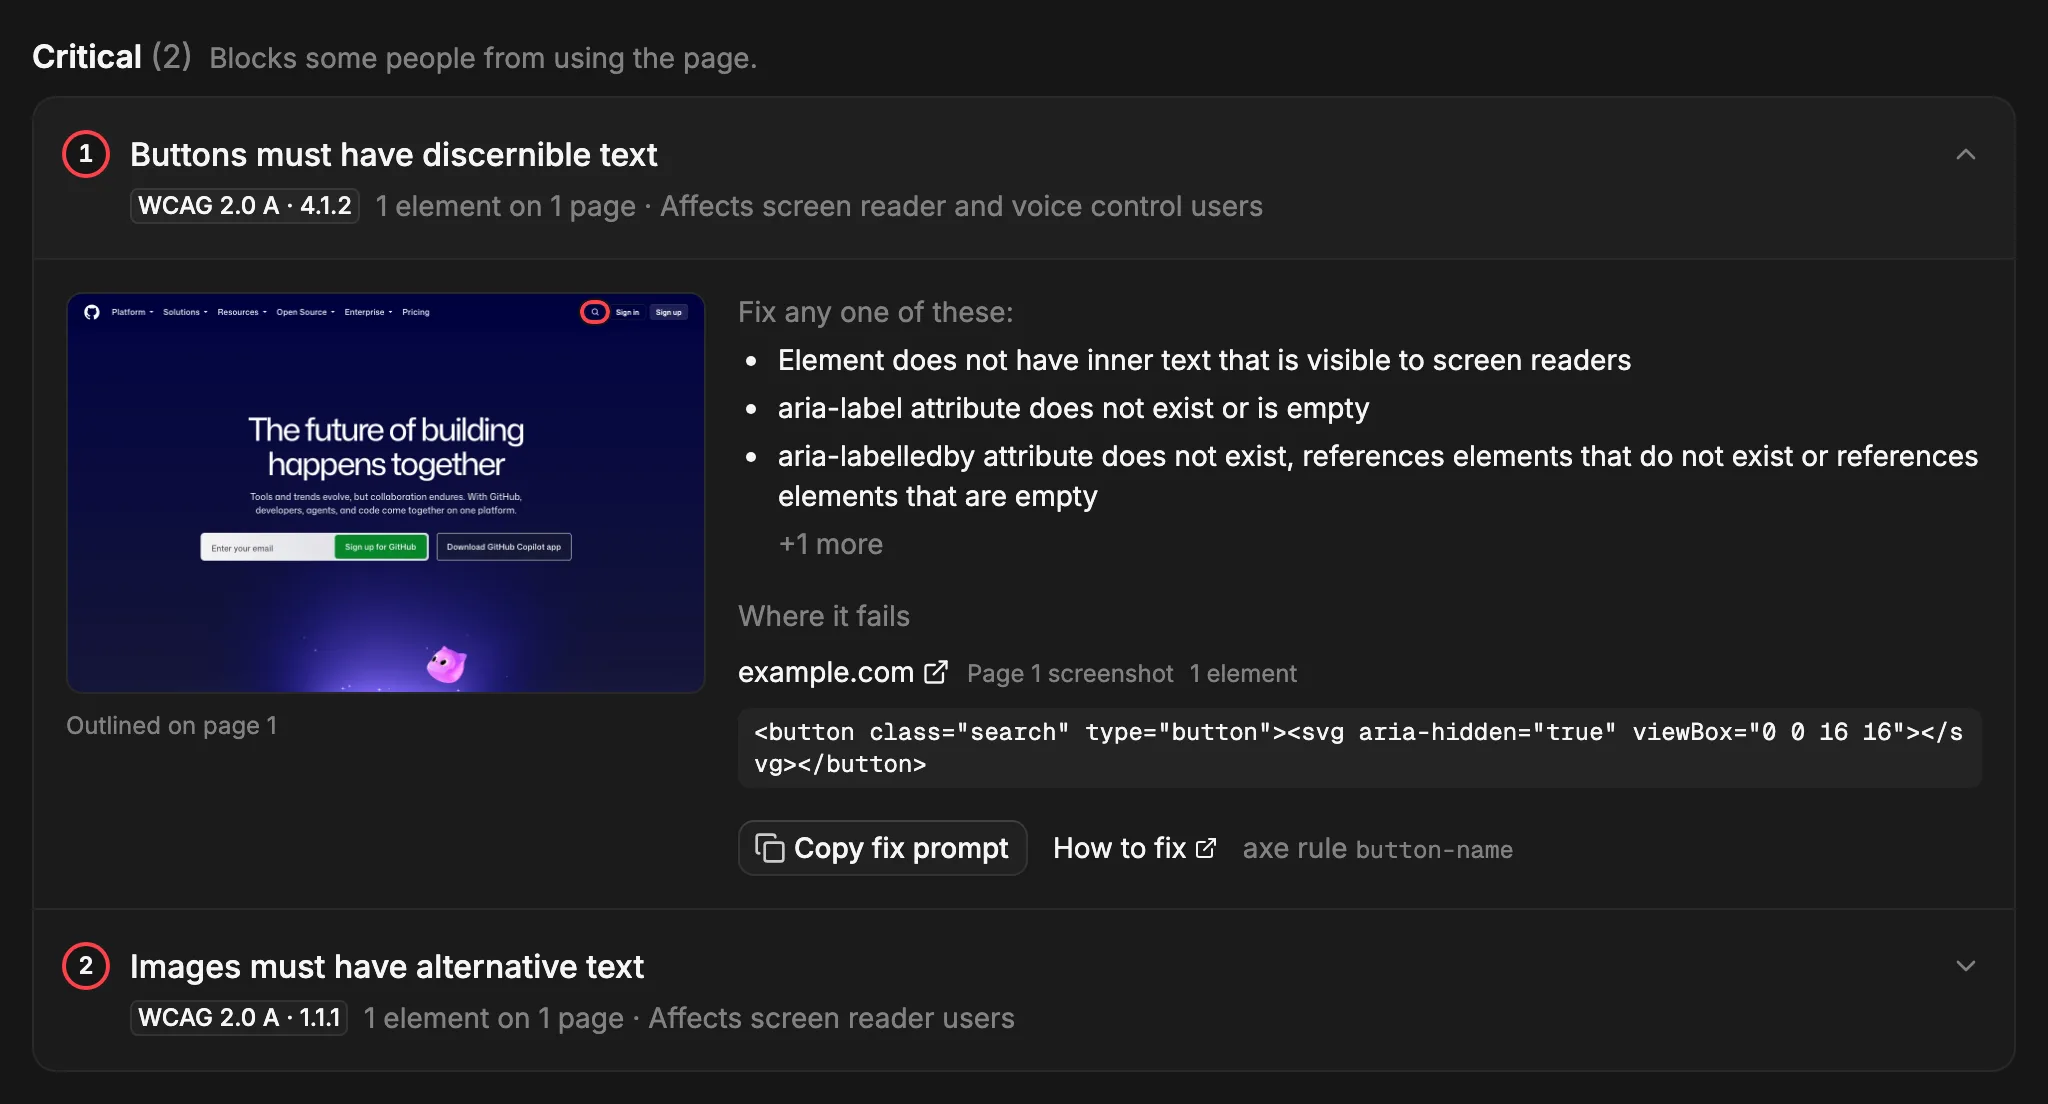
- Copy fix prompt
- Copies a prompt with the rule, the pages, and the failing markup, ready to paste into a coding assistant. “Copy a prompt for all issues” copies every rule at once.
- How to fix
- Deque University’s page for the rule, with examples.
- Needs a manual check
- Rules the check couldn’t decide on, like contrast over an image. Look at these yourself.
Styles that break the pattern
Each kind of element gets its own section, with one card per element, or set of elements, that’s off the same way.
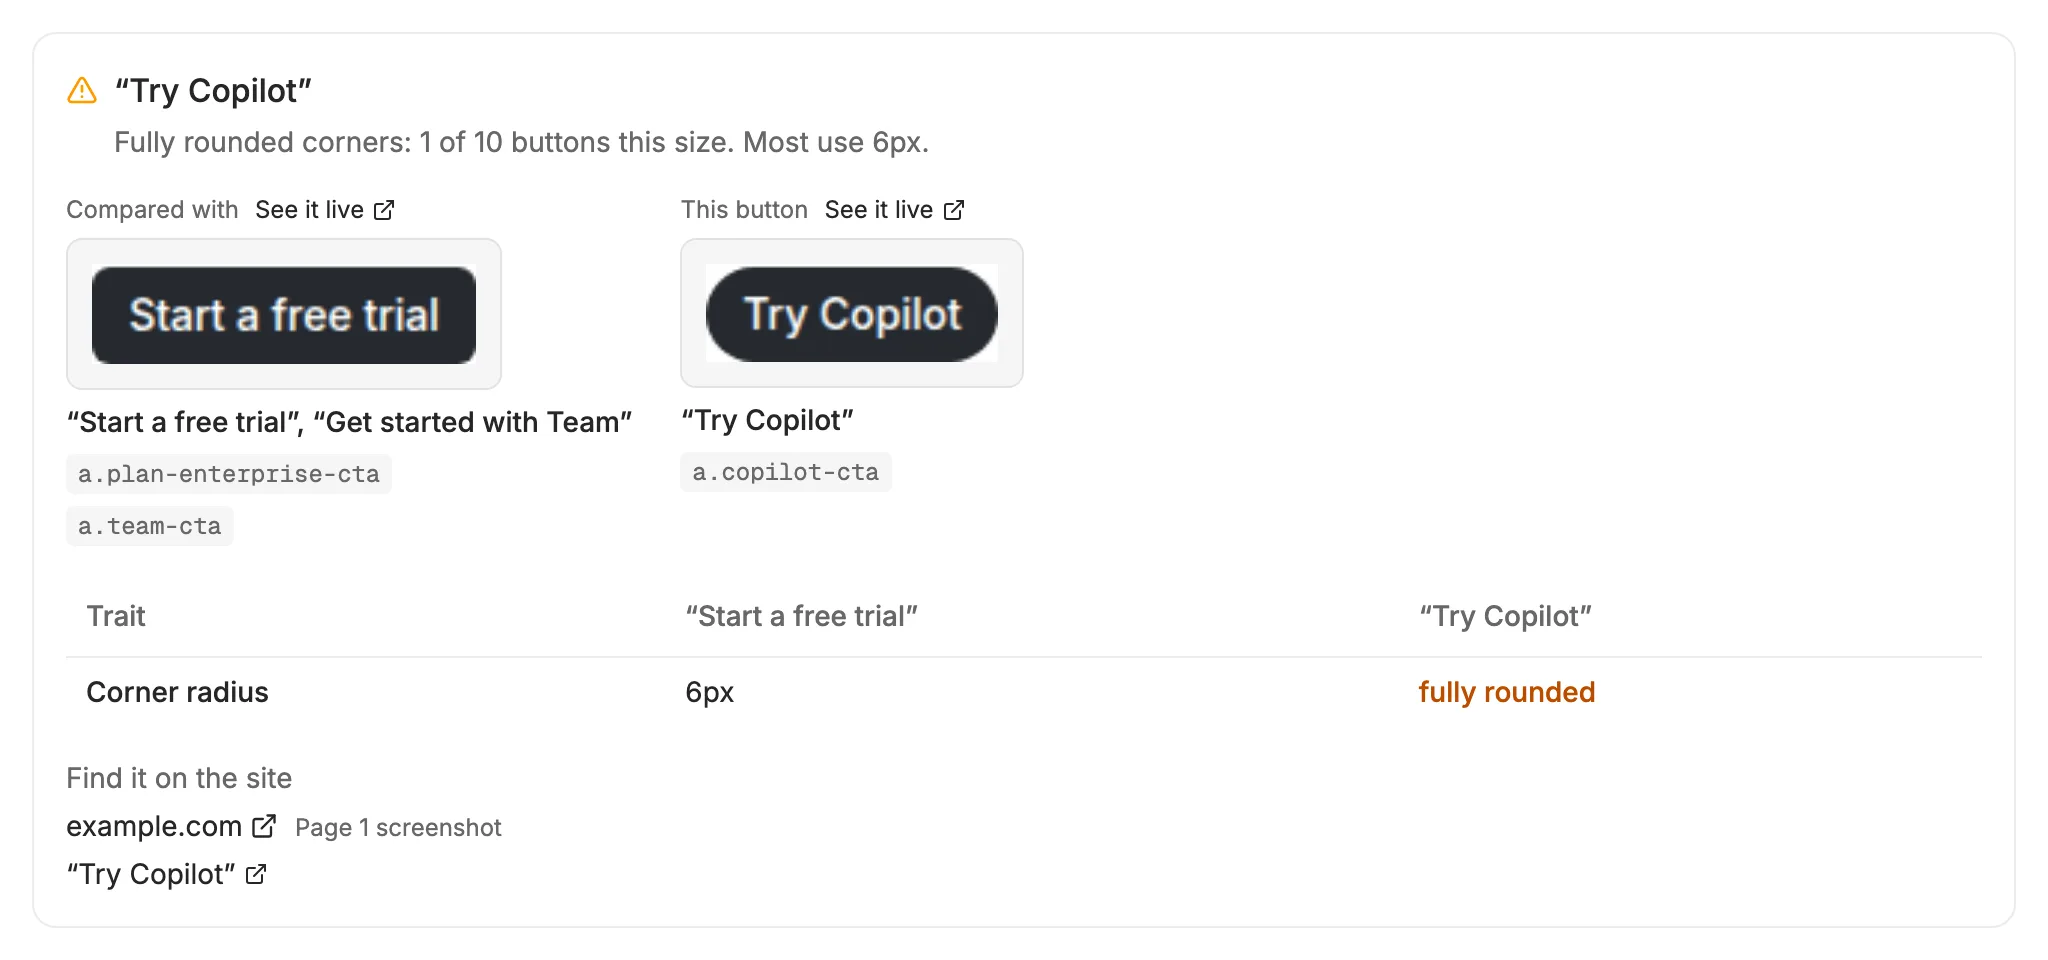
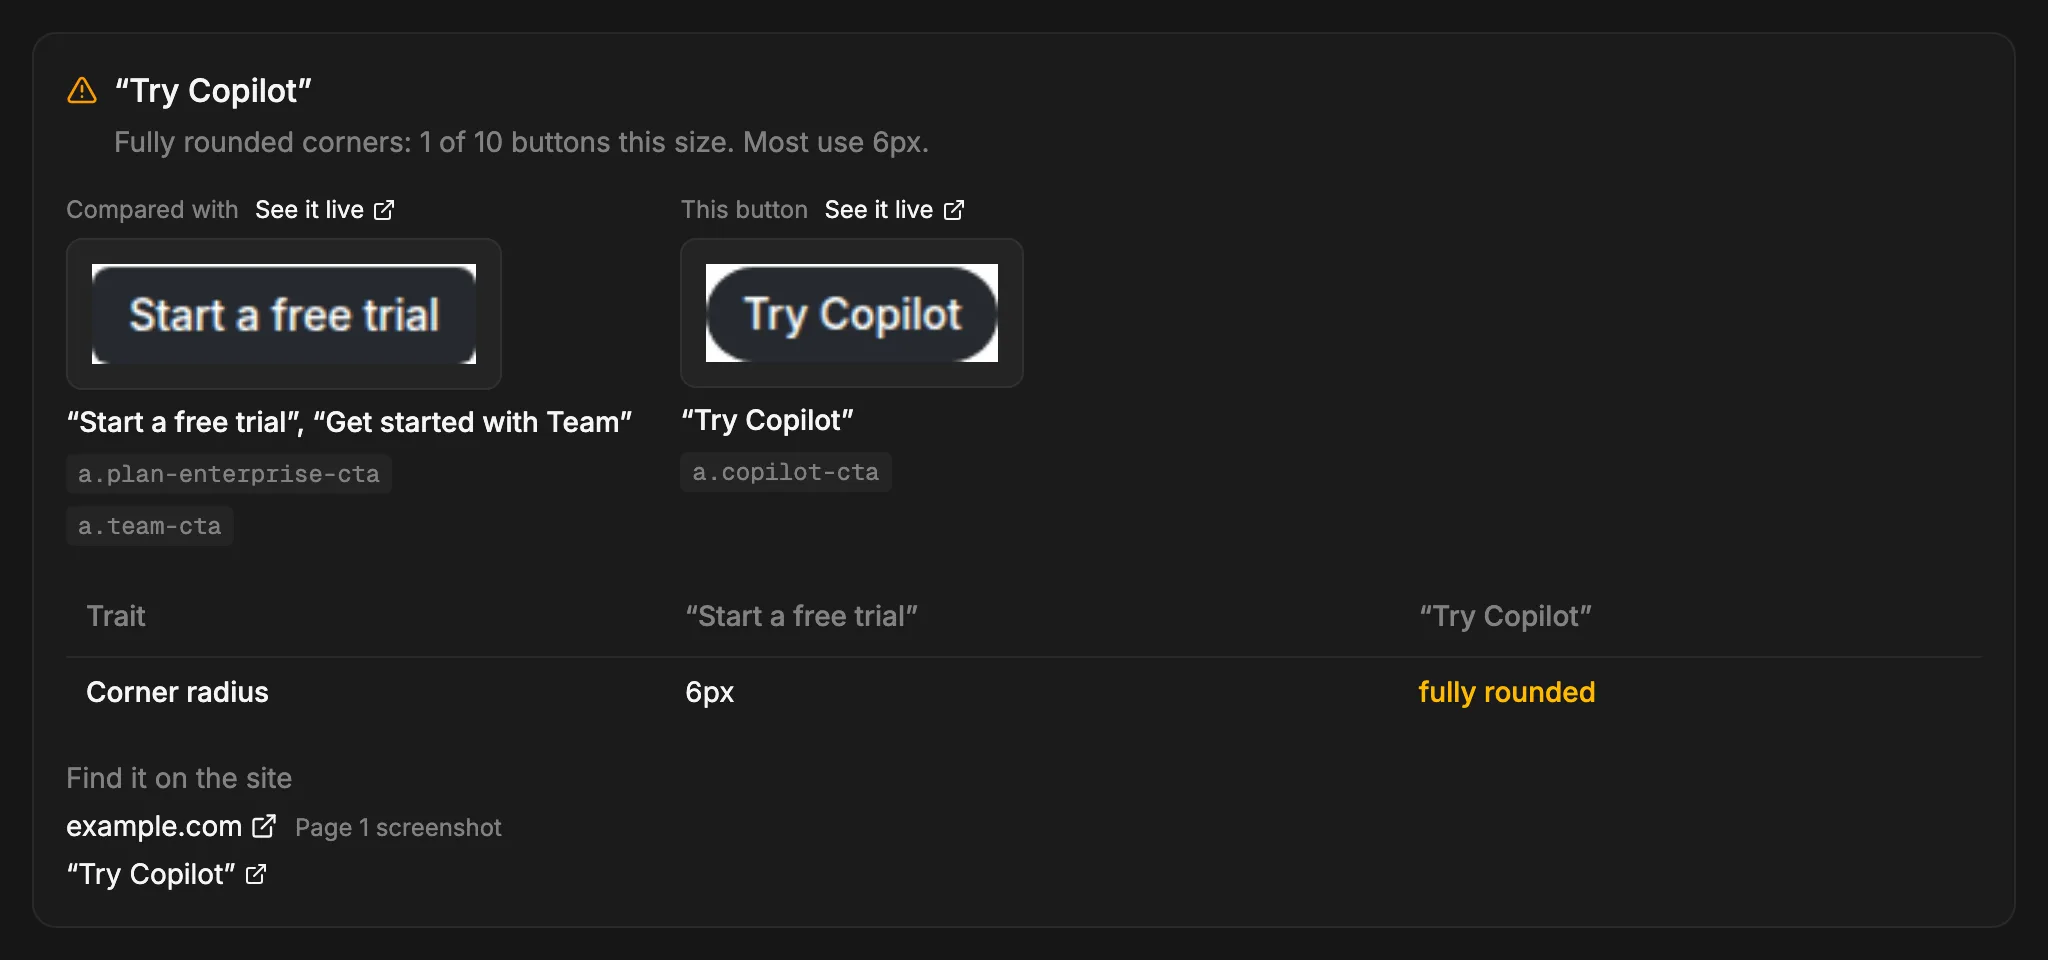
- The problem
- In words at the top, like “Fully rounded corners: 1 of 10 buttons this size. Most use 6px.”
- Compared with
- The site’s usual style beside the one that breaks it, each with its CSS selector so a developer can find it in the code.
- The traits table
- Only the traits that differ, with the odd value highlighted.
- Find it on the site
- Opens the live page scrolled to the element’s label, or jumps to the page’s screenshot in the report.
Page loads
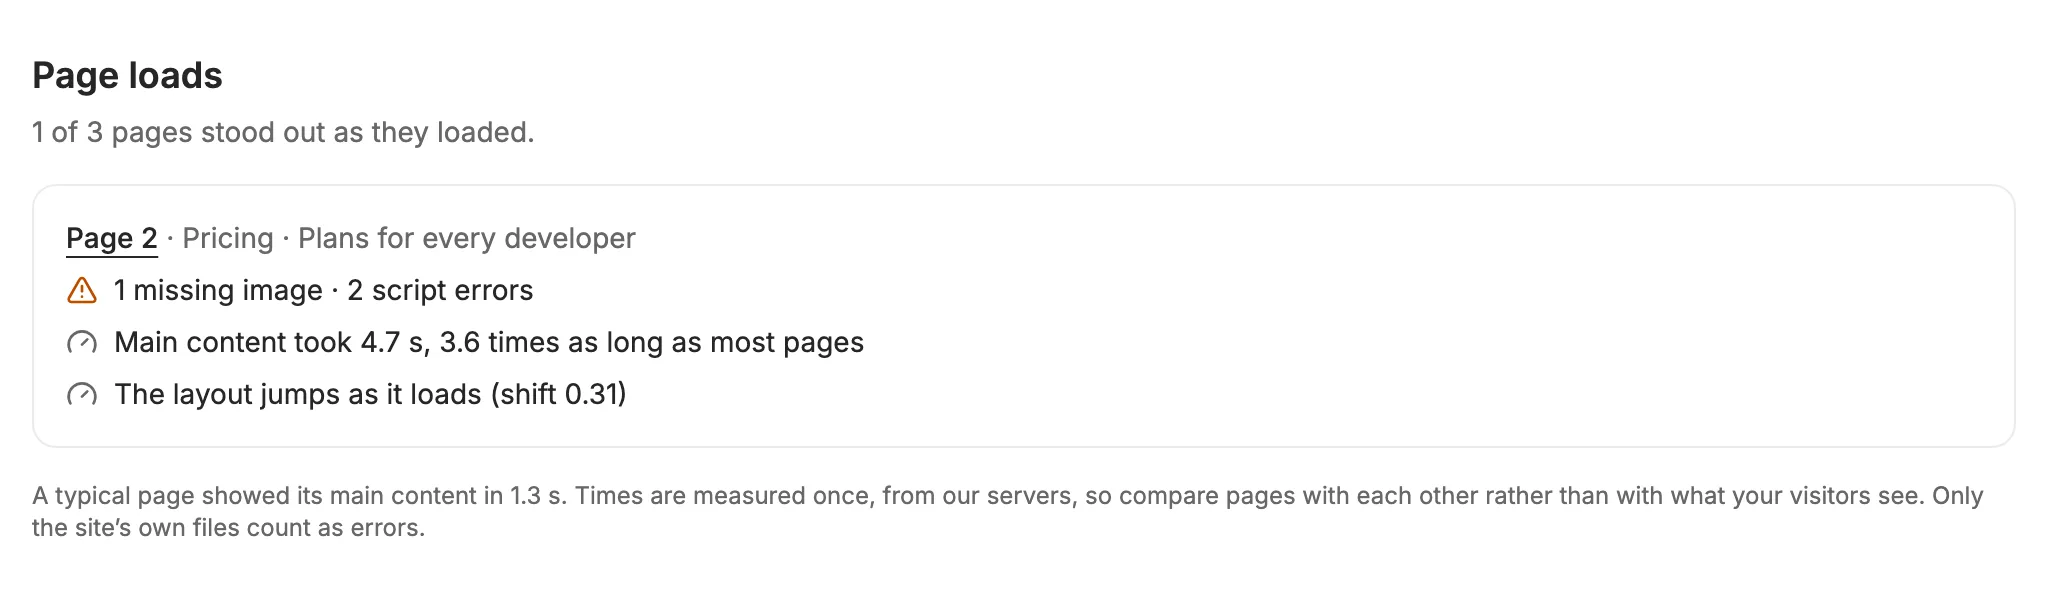
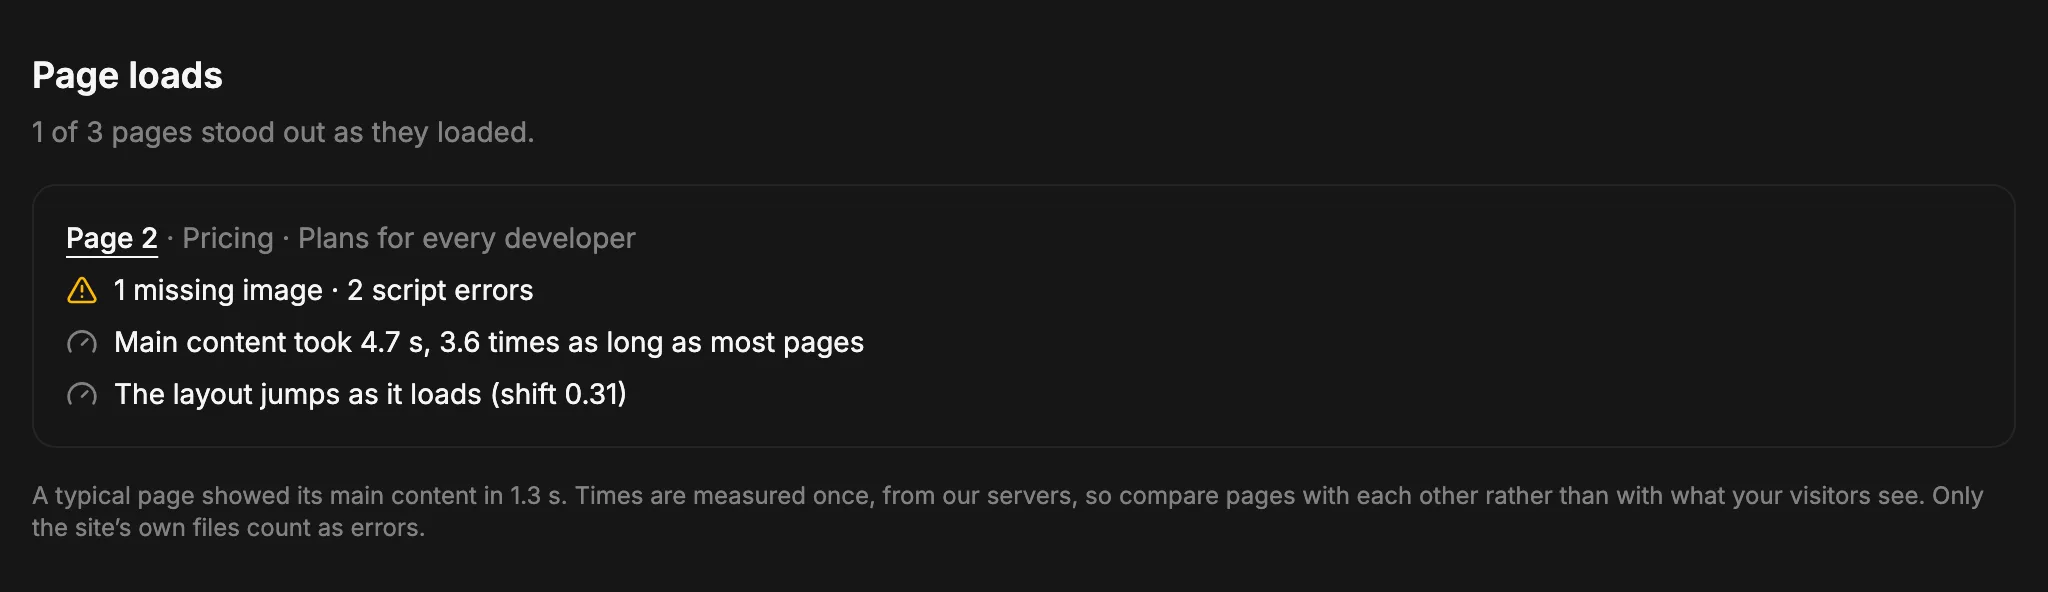
After the element sections, Page loads lists only the pages that stood out as they loaded. A page that loaded cleanly, at about the speed of the rest, isn’t listed.
- Errors
- The page was an error page (like Page not found), one of the site’s own images, scripts, styles, or fonts didn’t load, or a script failed. Another site’s ad or tracker doesn’t count.
- Slow
- The page took at least 1.5 times as long as a typical page on the site to show its main content, and over 2.5 seconds.
- Jumpy
- Its layout shifted as it loaded, so text or buttons moved under where someone was about to read or tap.
- Load times
- Open a page to see its own times under the screenshot: main content, first paint, the server’s answer, and layout shift.
Every page scanned
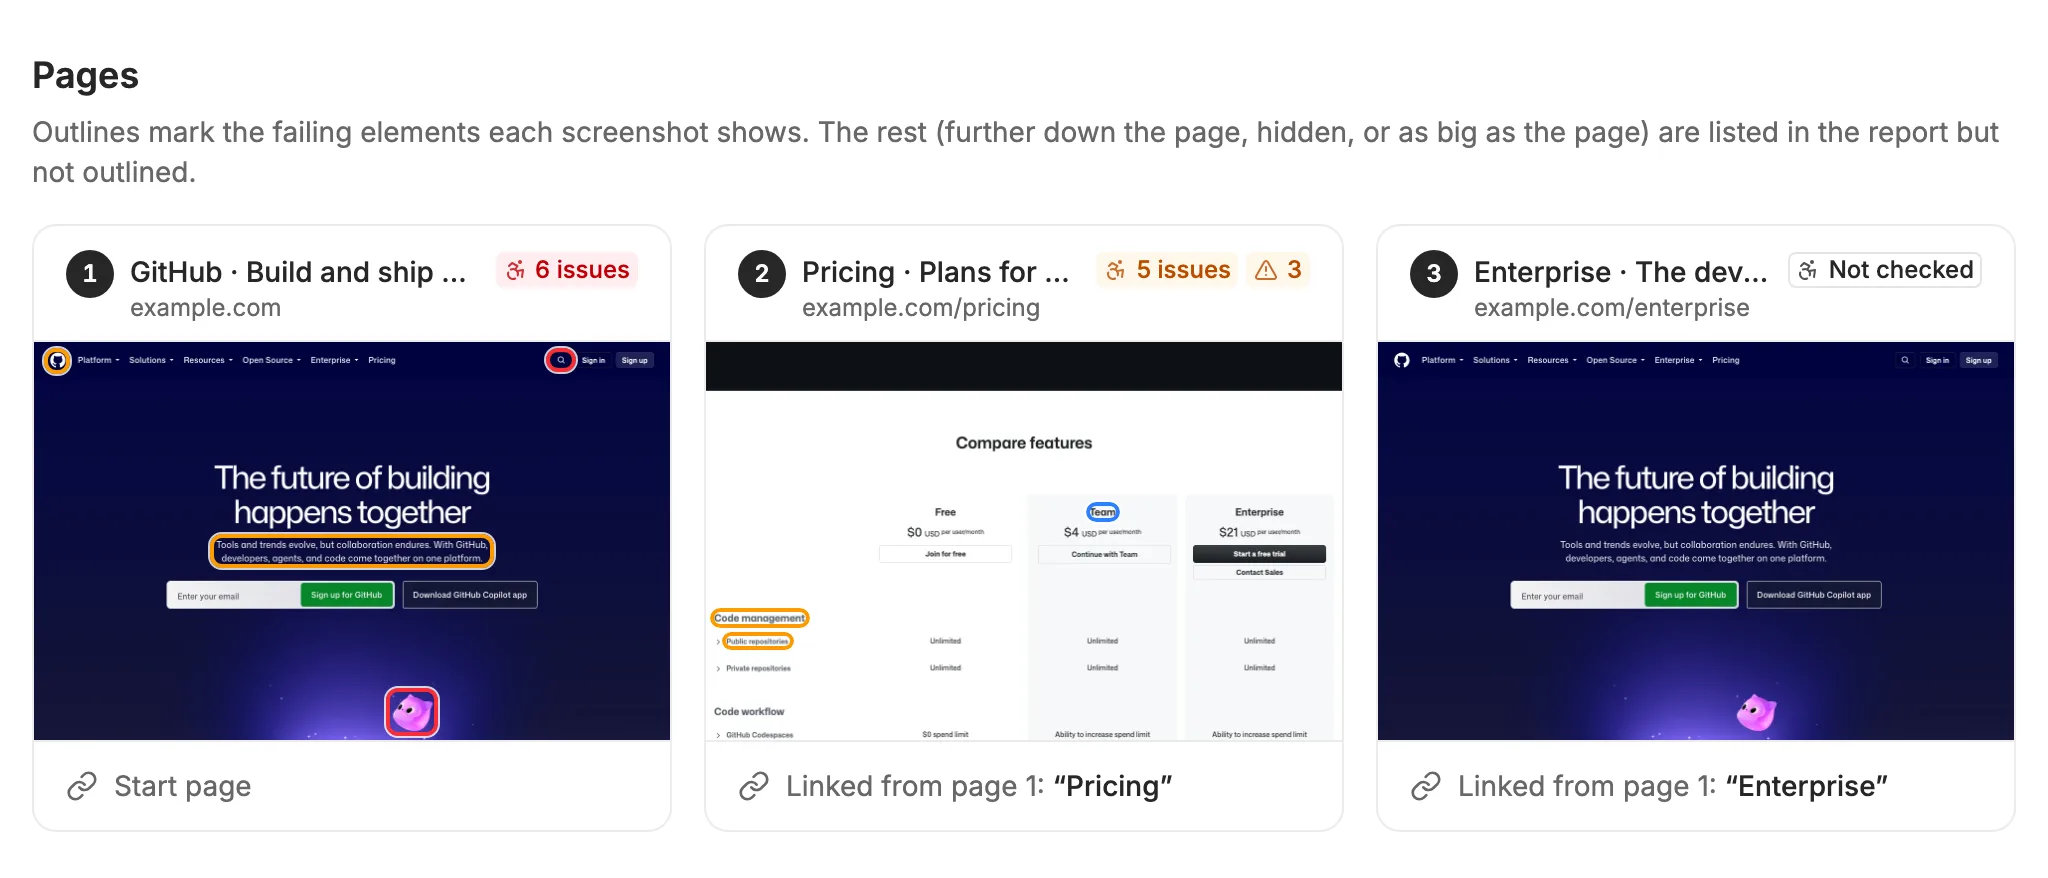
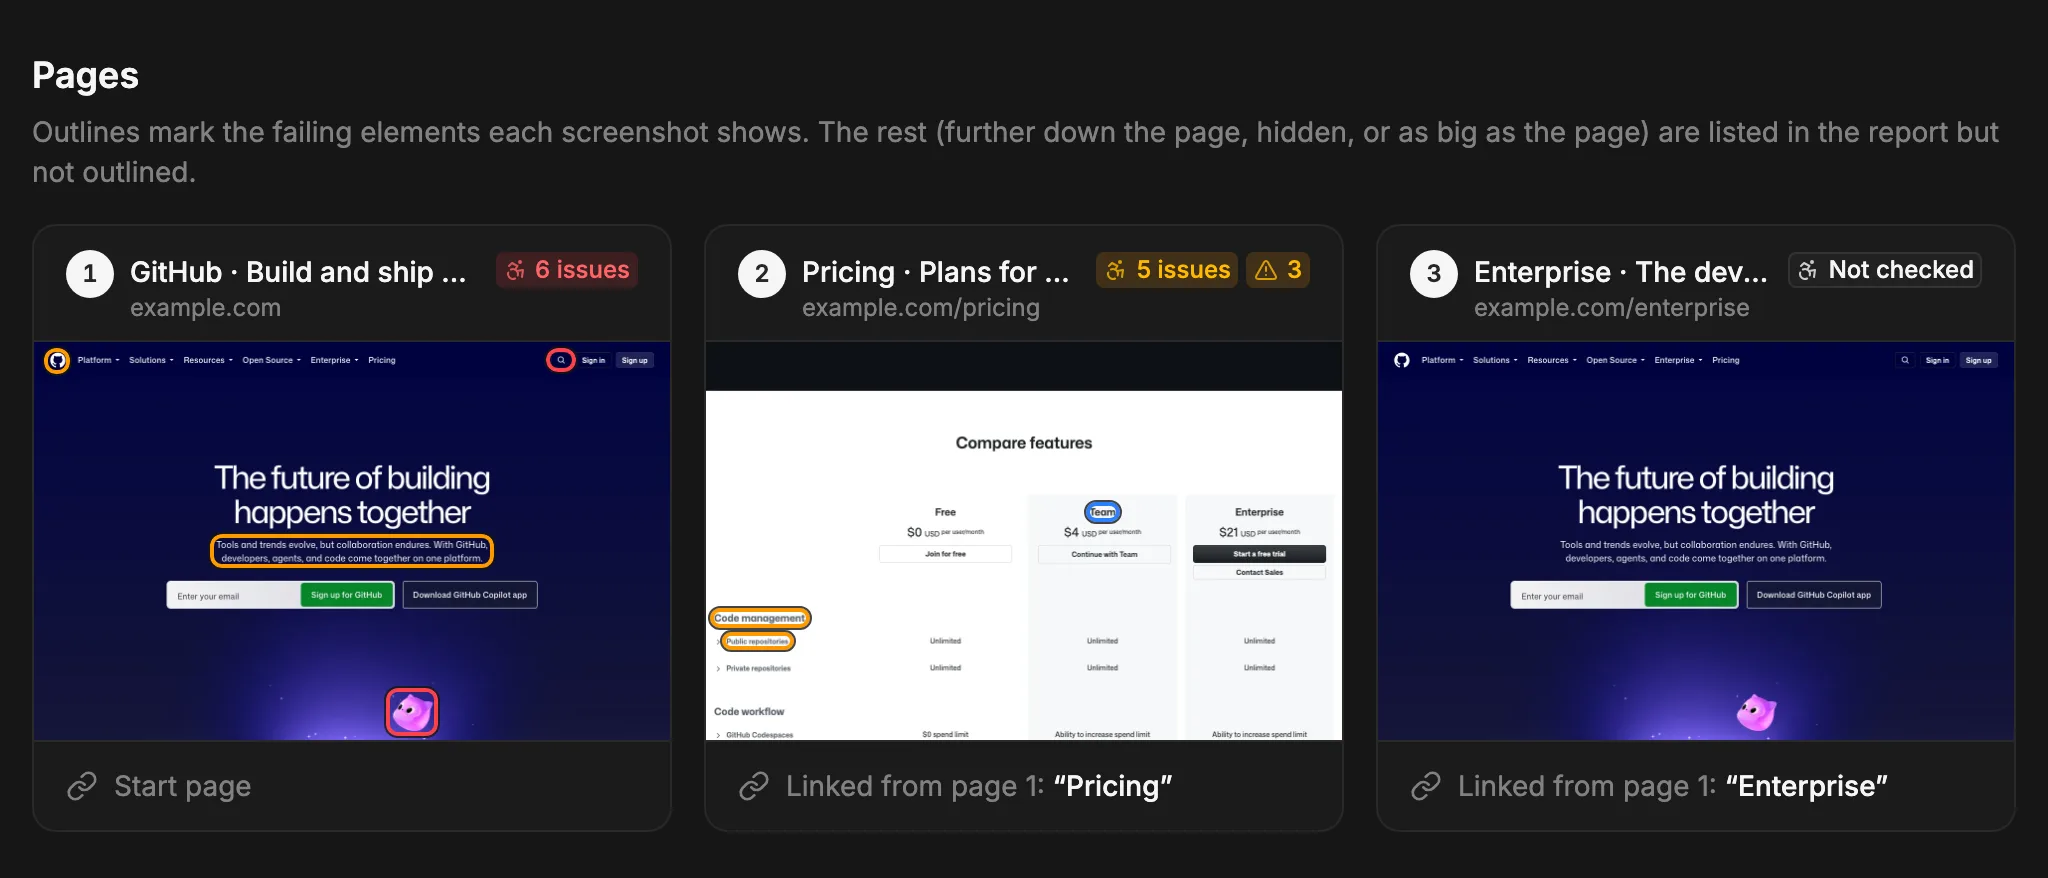
The report ends with every page it scanned. Failing elements are outlined in their impact’s color and numbered like the rules above. Select a page to open it, with its issues listed underneath.
When pages go unchecked
An audit stops scanning after about seven and a half minutes. A page it reached but couldn’t check is marked Not checked, and the report says why: the time limit, a page with more than 25,000 elements, or 3 pages in a row that failed to check. Scan fewer pages to give each one more time.
Before checking a page, an audit declines its cookie banner (never accepting it) and closes newsletter, promotion, and other popups. The report lists the pages where it declined a banner, and any page a popup still covered, since what was behind it may be missing from the results.